Information

Where does the rubbish on our beach come from?

© Victoria Barrell/Sussex Wildlife Trust

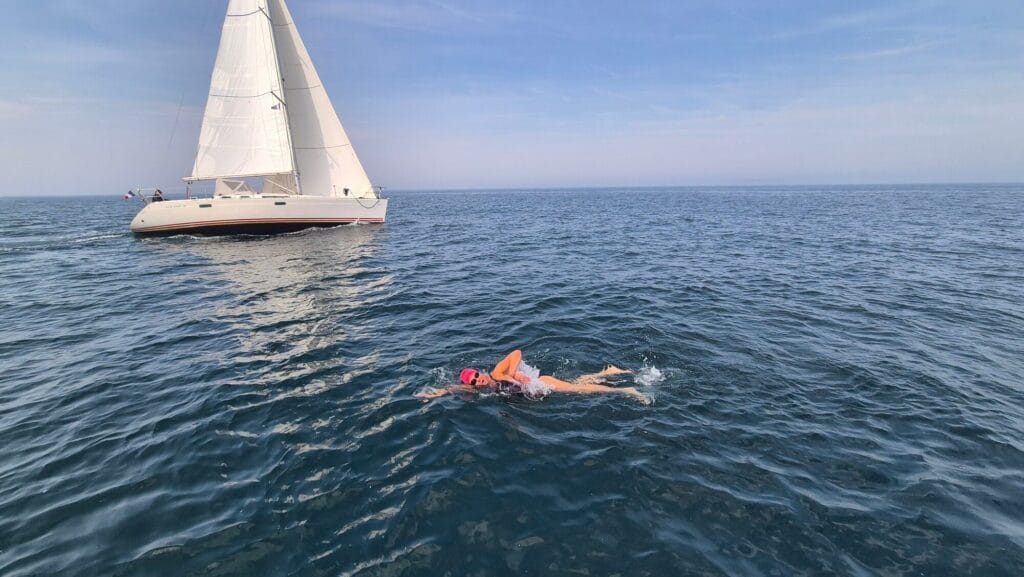
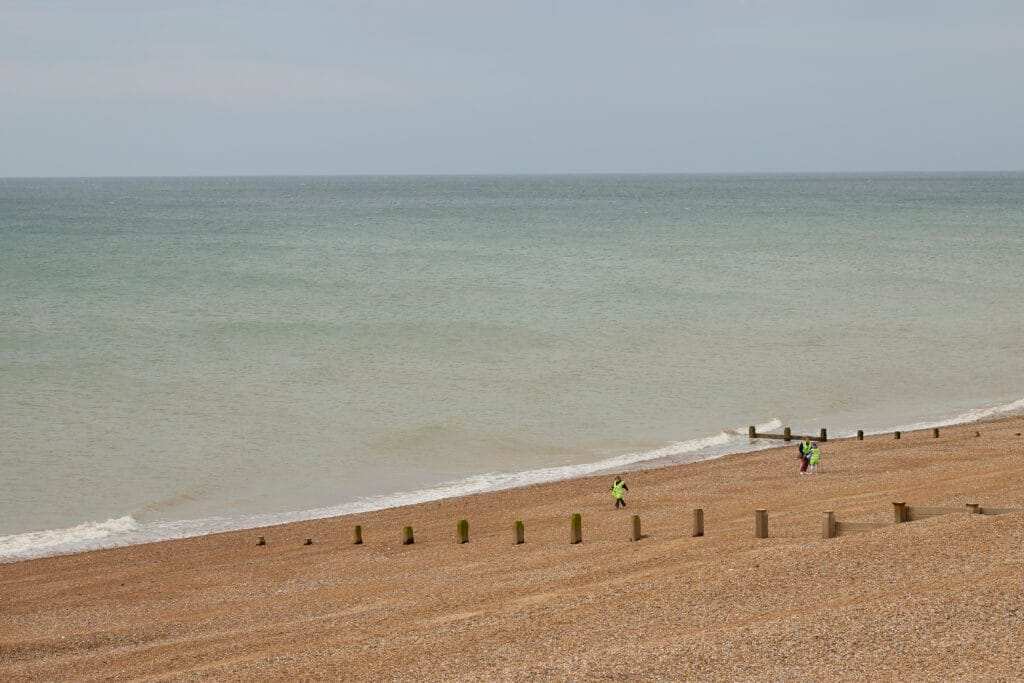
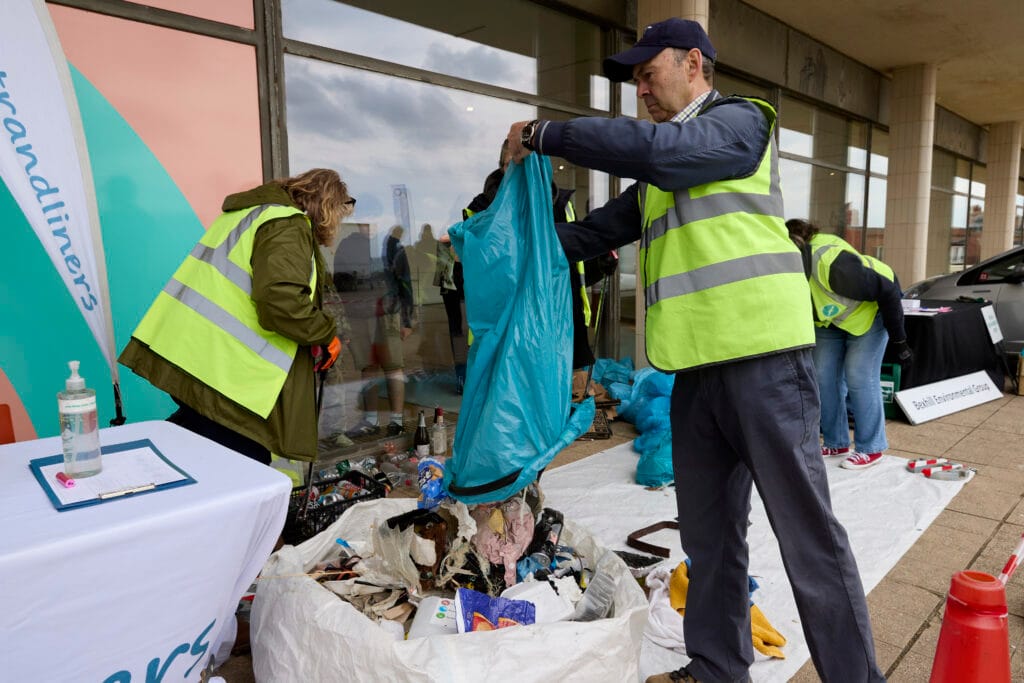
As part of the Attenborough Awareness Day event at the De La Warr Pavilion in Bexhill, celebrating David Attenborough’s 100th birthday, volunteers from Bexhill Environmental Group carried out a beach clean along Bexhill beach, and Strandliners undertook a brand audit of the rubbish, using the Million Mile Clean survey from Surfers Against Sewage (SAS).

What is a brand audit?
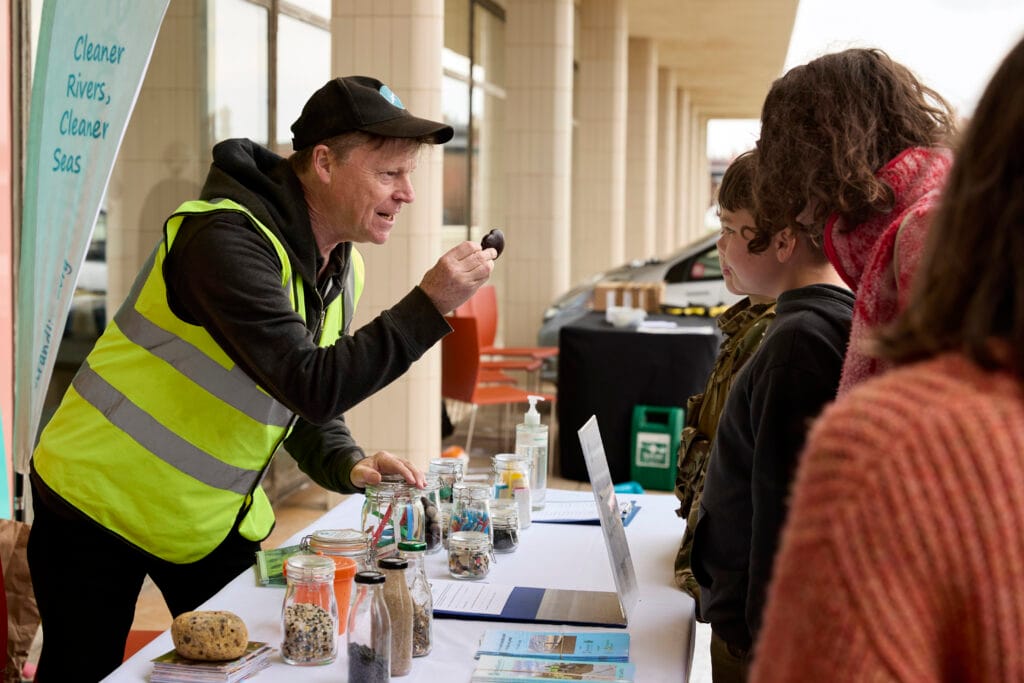
A brand audit is a citizen science initiative that involves counting and recording the brands found on litter to help identify the companies responsible for plastic pollution. The #BreakFreeFromPlastic methodology is also a record of the most common plastic polymers being produced and discarded. It can help improve the sustainability of companies and reduce unnecessary plastic. We can all do a brand audit at home or at work.

© Victoria Barrell/Sussex Wildlife Trust

What did we find?
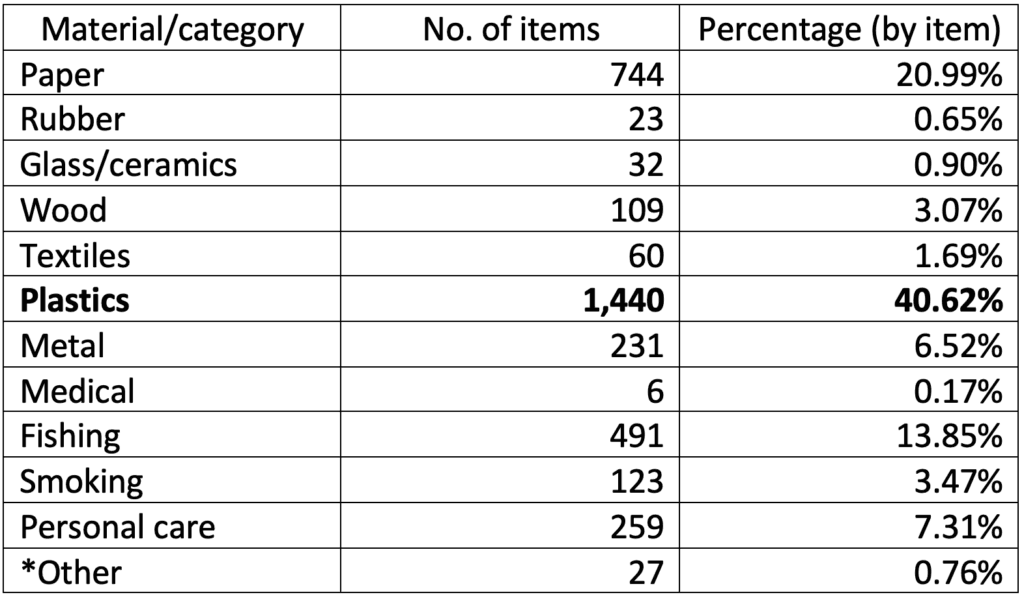
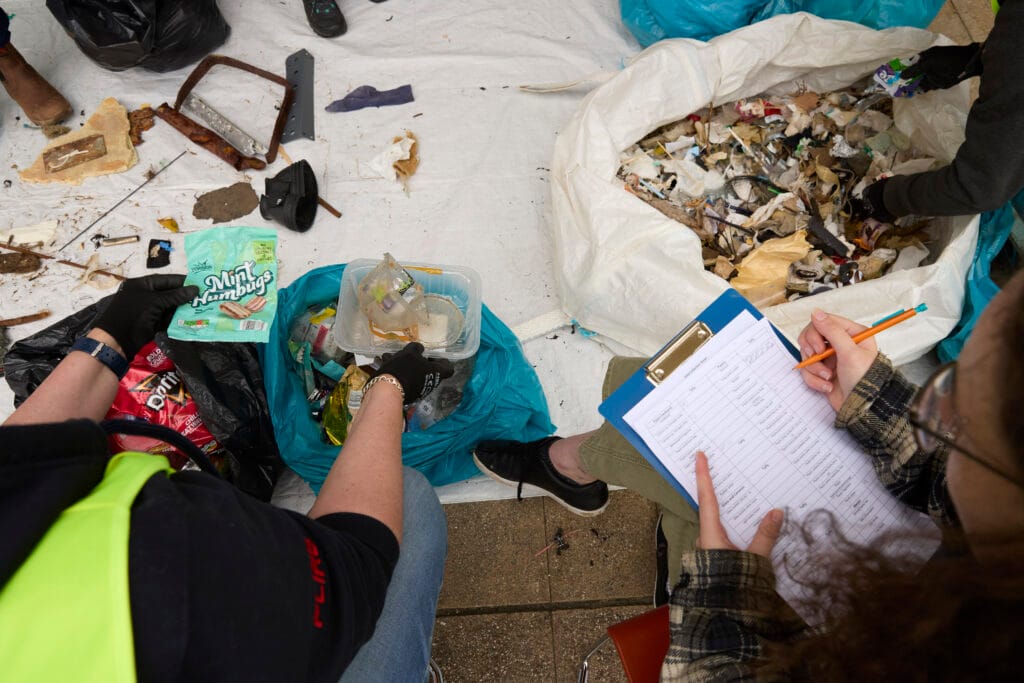
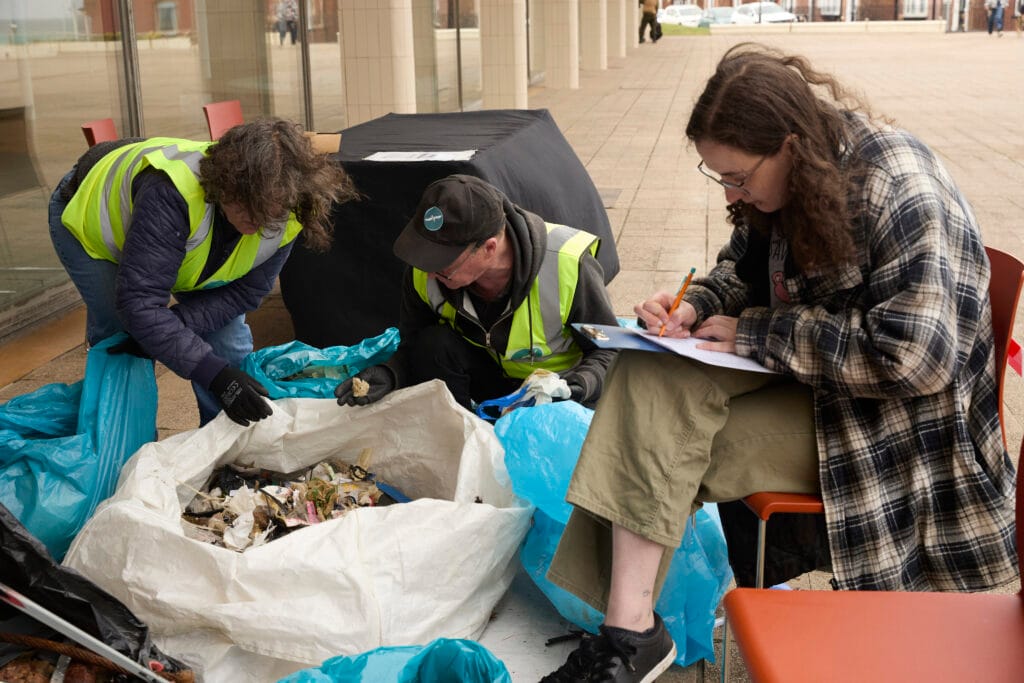
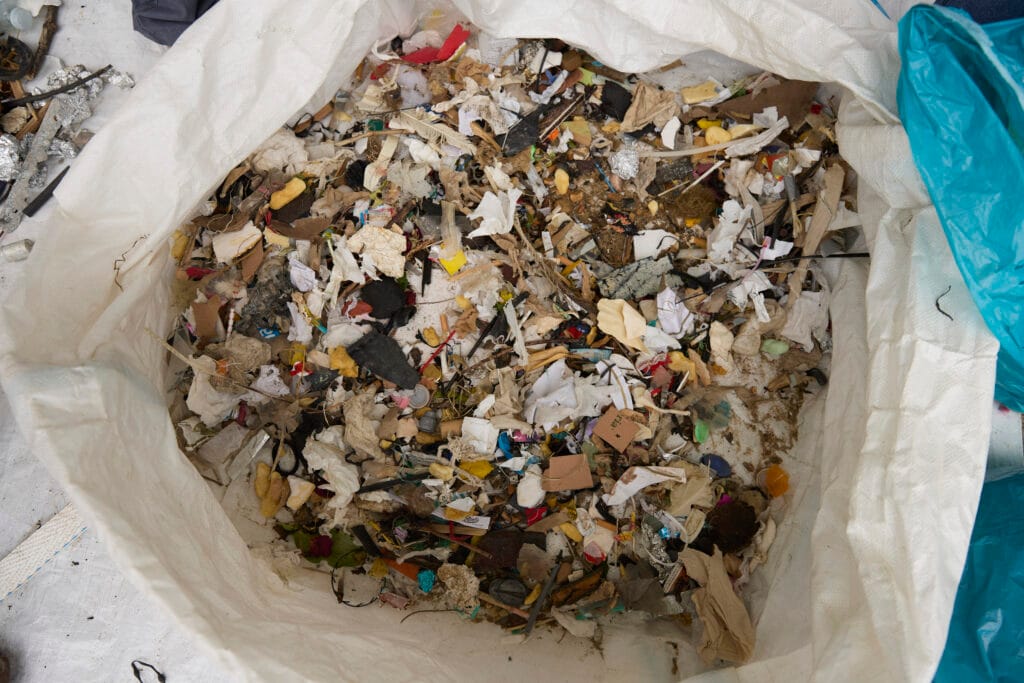
In a two-hour clean-up (from Cooden Beach to Glyne Gap) 55 volunteers found 3,545 items. The survey identifies items by material e.g. plastic or by use e.g. smoking.

*Other includes anything that does not fit into any of the above categories
© Victoria Barrell/Sussex Wildlife Trust

What does this tell us?
Not much, apart from the fact that there was an awful lot of rubbish found on what usually appears to be a clean beach – it is picked every morning by the local council, and potentially by beach visitors. Plastic is by the most commonly used material found. But what else do we know? We need to delve deeper.

Personal care
Among the most unpleasant items found were large amounts of toilet paper and wet wipes, some of which contained human excrement. This may sometimes happen if there are no toilets, but there are three public facilities along the sea front, which are all open (although the opening hours may be limited).

Brands
Over 600 branded items were identified, far higher than normal, but no brands were outstanding as the worst polluters. Only two brands had more than 20 items (Cadbury and McDonald’s); a few more had more than 10 items (Aldi, Tesco, Coca-Cola, Nestlé, Marlboro and a local restaurant) and many of the brands had just one or two items. In fact there were almost 300 different brands identified! This shows us that all brands are part of the problem.

© Victoria Barrell/Sussex Wildlife Trust

If we reorganise the items into categories used by #BreakFreeFromPlastic and the Preventing Plastic Pollution project in the Rother catchment, we can compare the data with past Strandliners’ surveys.

*Other includes balloons, microplastics, plastic fragments and small unidentifiable pieces
© Victoria Barrell/Sussex Wildlife Trust

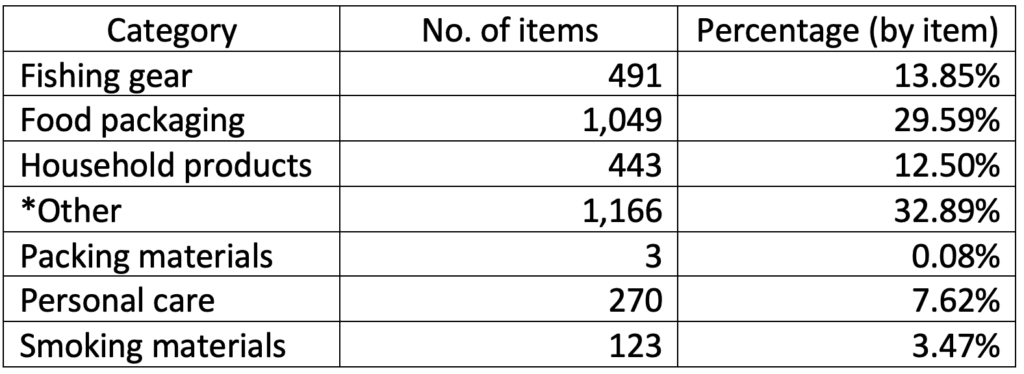
A pie chart gives us a visual representation of the data and lets us compare easily areas easily.
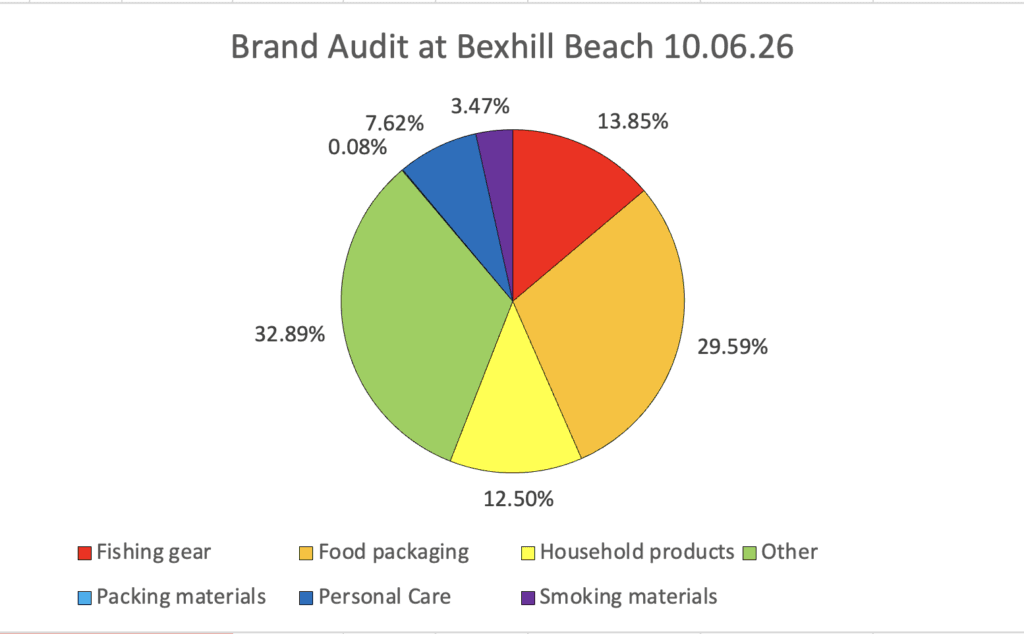
Fishing items
These are to be expected along the busy English Channel. Generally, we cannot tell where they came from, although we did find a few tags from a Newhaven-based boat in this survey, and we do occasionally find items from North America. We have to remember that things may not be discarded deliberately; when out in a rough sea, it is not easy to keep hold of everything!

Food packaging
This is typically one of the highest categories in a brand audit survey. While there are many sources of litter on our beaches, the amount of takeaway packaging (particularly fish and chip packaging and local restaurant packaging) and associated items such as napkins, suggests that food eaten on the beach can cause issues. We found a till receipt from a bar in Spain, and a bistro in France (though they probably crossed the channel in someone’s pocket!). One food packaging item from the 1980’s was found: a Smarties lid embossed with Rowntrees (before Nestle took over and changed the branding to Smarties). See our blog on Smartie lids.
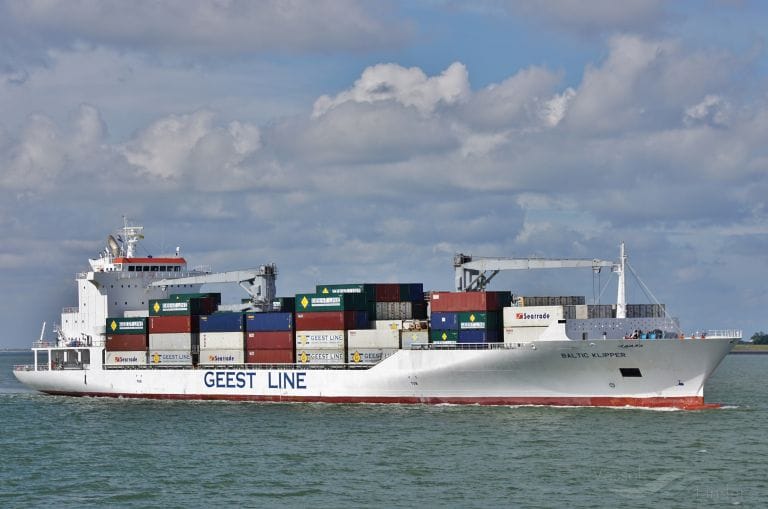
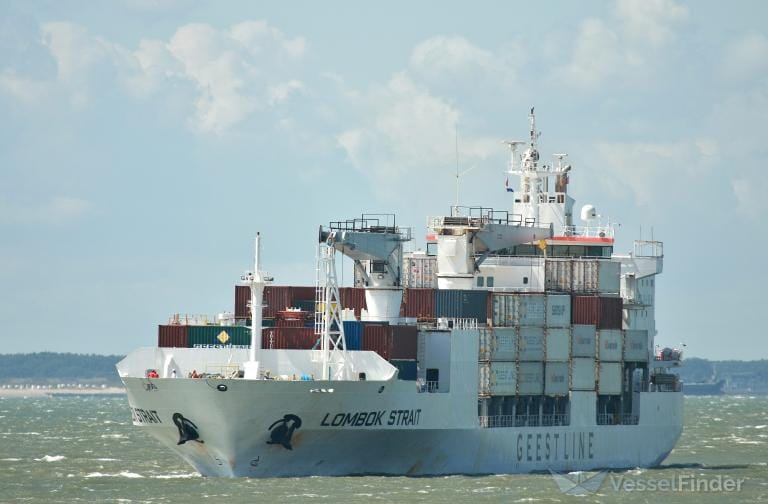
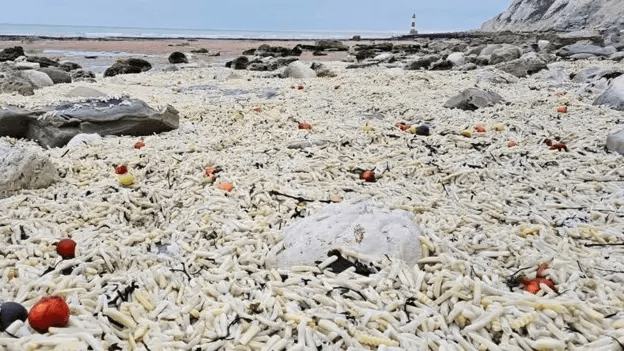
Container spills
In this survey, the ‘other’ category was very high. This was partly due to the many small pieces of foam insulation from the refrigerated containers lost at sea last winter (see our blog). Whilst most of the large pieces of foam were picked up and disposed of shortly after the event, small pieces will be found for many years to come. We are still finding items from historic container spills; in this survey an item from a 2007 container spill was found by an eagle-eyed BEG volunteer.

Litter from many sources
Although in this case it seems like much of the litter was from the public, beach visitors, and food eaten on the beach, one surprising item was a piece of detonation cord or shock tubing used by the US Army Corps of Engineers when Boston Harbour in Massachusetts was dredged in 2021/22 to make the harbour deeper, allowing bigger ships to enter. Strandliners have been finding this tubing since 2023, although fewer pieces are washing up now.  See our blog on detonation cord here.

© Victoria Barrell/Sussex Wildlife Trust

If you’d like to know more about the SAS brand audit, you can read their 2025 report here.

Information

Queens of the Rother

Les Reines du Rother are swimmers who care deeply about water quality. Swimming the River Rother and becoming increasingly aware of the issues our rivers and sea face led to the thought: what can we do to attempt to make a difference?

Isabelle Lavigne, Katherine Drew, Sophia Bartleet and Claire Reed, who all live in West Kent, decided to swim the English Channel to raise money for both Strandliners and Surfers Against Sewage. Strandliners is a Rye-based group that collects data on rubbish and monitors water quality to use as evidence for larger groups to lobby for change. Surfers Against Sewage provides a national water quality app and campaigns for water companies and polluters to be held responsible for what they put in our water.

Anxious smiles hours before the start

The team, whose name was inspired by Isabelle’s nationality, was trained by veteran Channel swimmer Tony Ferguson, whose experience and encouragement were invaluable. Claire says: “The swim was way out of my comfort zone, but I realised if I didn’t try this, I would always regret it. There were times during training when we had to clear rubbish left by others before we got into the water. Strandliners and Surfers Against Sewage are working hard to put pressure on the water companies and government to clear up our rivers and seas, so we chose to raise funds to help with this important mission.”

Months of training, including swimming the River Rother in all conditions, preceded the planned departure date in June. A few ‘double dip’ sessions in Dover Harbour aimed to simulate the experience of a relay when each member of the group swims for an hour and then warms up for three hours before returning to the water – repeating four or five times until France is reached! As Sophia says of the Dover training: “The water was a brutally cold 14 degrees, so we weren’t quite so smiley second time around!”

Planning to set off in late June, the team booked a practice session with the piloting boat and team in Dover for Saturday 30th May. When they messaged Stuart Gleeson, the pilot, to finalise the details he suggested that they could embark on the crossing itself that weekend because the forecast conditions were so good. Sophia says: “It was quite a surprise for all of us, but we knew that the weather in the Channel is very unpredictable, so it was worth going for it while it was so calm.”

Les Reines du Rother on board and ready for a team talk before setting off

With just 48 hours’ notice, the team set off from Samphire Ho on Friday 29th May just before 11pm, with Claire taking the first leg, to be followed by Sophia, Katherine and Isabelle. When not swimming, the task was to encourage the person in the water, as well as help warm up whomever had just come out – no easy task in very cold-water conditions. Also on board the Sea Leopard was its pilot and crew, trainer Tony and an observer from the Channel Swimming Association (CSA), who ensures official regulations are adhered to!

The rules stipulate that swimmers can only wear a costume, swimming hat and goggles (no wetsuit) – this is to ensure that the conditions are the same as those experienced by the very first Channel swimmer, Captain Matthew Webb in 1875.

There is much to consider when deciding whether to take on this challenge, but the Channel Swimming Association (CSA) helps immensely, providing answers to all those questions you may have: how long will it take? Why can’t I swim straight across? Will I have to wear grease? Is there much rubbish? Will there be jellyfish?

The Channel is a very busy shipping route

Swimming through walls of jellyfish and some cuttlefish were a new challenge compared to the training days in the sleepy River Rother, as was swimming in the darkness of the night. Discovering plastic water containers floating in the central section and even some deflated helium balloons may not have been a surprise but continued to show our waters are not in a good state.

The CSA provides an interactive map for tracking progress and many people from around the world kept up to date with the team’s efforts. The Sea Leopard route took an ‘S’ shape due to the tidal conditions.

Katherine says: “Despite all the training, nothing can quite prepare you for the reality of the swim. It was really tough – and we only managed to keep going because of the camaraderie and mutual encouragement from the team, and all those supporting us from afar with their messages and donations.”

Sophia adds: “It was also very touch and go. The current along the French coast was very strong, in part because we were swimming on a spring rather than a neap tide, and we were really struggling to get into shore before the Calais Exclusion Zone, which is forbidden to swimmers. We all had to put everything into it at the point when we thought we had reached exhaustion.”

The route needs to take tides, currents and the wind into account

Teamwork certainly comes to the fore in a Channel swim, with family, friends and colleagues, the pilot and crew on board the escort boat and the CSA observer all helping ensure it is both possible and safe.

Not far now…
Made it!

Les Reines du Rother made the crossing in 16 hours and 35 minutes. What an extraordinary feat. It is 100 years since the first woman swimmer to swim the Channel, Trudy Ederle, Queen of the Waves.

There is just still time to donate for these women whose concern for the health of our rivers and seas fuelled their courage and determination to raise awareness. You can find their just giving page here.

Celebration!

Andy Dinsdale and William Drew

Information

Is this the shape of things to come?

The recent container spills are the exceptions to the norm, as they have a point source, meaning they have a specific traceable source.

The Baltic Klipper is a refrigerated cargo ship built in 2010 and currently sailing under the flag of Liberia.(Image: Vessel Finder)

The 16 containers lost in December 2025 from the Baltic Klipper off the Isle of Wight that brought bananas to Selsey Beach, are an example.  This incident was followed by 17 containers lost from the Lombok Strait and 7 empty containers lost from the Condor Valparaiso during Storm Goretti in January, resulting in a variety of goods strewn across our beaches in Sussex, from onions and garlic to frozen chips, along with foam insulation from the containers themselves.

The Lombok Strait is a refrigerated cargo ship built in 2002 and currently sailing under the flag of Liberia (Image: Vessel Finder)

As long as humans have been seafarers, there have been accidents at sea where ships and cargo have been lost to the waves. Once upon a time the resulting flotsam would have been natural materials, for example coal, wool and grain. This changed with the industrial revolution and the development of global markets, leading to larger and faster ships to carry produce around the world. After WW2, the increasing production of plastic, government subsidies, and persistent marketing created a massive explosion in the demand for products from across the world.  

90% of all we own has been traded by sea and has spent time in a shipping container. Ships are still increasing in size; today some can carry 24,000 containers (holding the equivalent of around 1 billion cans of baked beans). Over 6,000 ships are in operation at any one time globally, carrying as many as 20 million containers between them.

In the twelve years up to 2020, an average of 1,382 containers fell overboard each year. The worst incident was the loss of all 4,293 containers from the MOL Comfort in the Indian Ocean in 2013. Most are lost through extreme weather, human error or structural failure.

There has been a recent (long-campaigned for) change in legislation. The International Maritime Organization introduced new regulations on 1st January; shipping companies must now report all containers lost at sea. Previously, they only had to do this if the contents were toxic or the lost containers were a hazard to shipping.

Chips on the beach at Eastbourne (Image: Sussex Express)

The immediate problem is the pollution from the containers and its removal to reduce the impact on the environment and local wildlife. There have been increased reports of stranded cetaceans, seals, fish and birds washed up on our beaches recently. The large quantities of chips and onions may decompose if they are left, but with what consequences for the ecosystem? The foam insulation will break up into smaller and smaller pieces. Who should bear the cost of cleaning up this pollution. Local communities and cash-strapped councils?

The shape of things to come may be more container spills through a greater fleet of larger ships working non-stop to cater for our needs, influenced by more frequent and more extreme weather events as our climate changes. We like all the things we buy. We’d probably also like to see our beaches less polluted. So what can we do? If we want to reduce plastic pollution, our most important objectives should be to buy local. If we can help to create greater local markets there will be less need to transport goods over large distances. Let’s support local producers and craftsmen, where good value food and commodities are produced (or repaired) locally. Who knows, this may even lead to happier, more connected communities

Information

Up in smoke – what happens to your black bin waste

Looking into the furnace

Graham Ellis of Rye Sustainable Living Forum organised a trip to the Newhaven Energy Recovery Facility, which takes all our non-recycled domestic waste. The facility is in effect a large incinerator which uses the heat from burning up to 210,000 tonnes of waste per year, to generate electricity for the National Grid to power about 25,000 homes. 

Model of the facility

The facility was seen as controversial prior to its construction in 2008.  The Rother Environmental Group was concerned that the facility would necessitate a constant flow of waste over its lifetime, at the expense of recycling programmes. In the event, there has never been a shortage of waste to burn since its completion in 2011 and doesn’t in itself prevent increased recycling. The Veolia contract runs until 2033 and the lifespan of the facility is a maximum of 50 years.

One of the most reassuring things to report is that at no time has the facility been used to burn waste collected for recycling. None of what you put into your recycling bin will be burnt, other than what is rejected in the Materials Reclamation Facilities (see previous article).

About 58% of all the waste we produce is turned into energy in Newhaven, with 41% being recycled or reused and just 1% going to landfill. In practice, these figures have barely changed in the last 10 years. Sadly, there appears to be a ceiling to recycling.

The facility manager, Martin Micallef, together with Steph of Veolia South Downs Ltd, took us on a tour of the facility that employs 36 staff. It’s a neat design, certainly compared to the rather ramshackle recycling and storage depots along the access road. The whole site is surrounded by a bund, to 5m above sea level, and is part of the Newhaven flood protection. All the rainwater is stored on site and used for quenching the ash.

The tipping hall

The waste arrives for the most part in large 23 tonne capacity articulated trucks from waste transfer stations across the county. The tipping hall can take up to eight of these at a time, although in practice there are always fewer. Some waste also arrives in street cages and trucks. Each day it’s about 650 tonnes that is delivered. Most of that is from homes in East Sussex, although there are some commercial companies using the facility too. When we were there, a truck from Gatwick airport was emptying its load. 

The whole facility operates at negative air pressure, to ensure no dust or contaminants escape. 160,000 m3 of air is drawn in per hour, and a megadoor is fitted to the reception hall to minimise the escape of air.

Surprisingly, part of the facility is below ground, to a depth of 20m. That allows for a large bunker to fill with waste, with a 4000 tonne capacity, creating a buffer that can allow for outages as well as peaks and troughs in waste supply. Unsurprisingly, there is more waste after Christmas, with a low period in March. Every three months, the waste is surveyed to find out what changes are occurring in the waste streams. 

Two relatively new waste streams are a concern

Disposable E-cigarettes, or vapes, can burst into flames at any time prior to arrival at the facility. They have caused a significant rise in fires at waste transfer sites and recycling plants around the UK, releasing toxic fumes into the environment in the process. Well over a million disposable vapes are thrown away each week in the UK, with many of them find their way into general waste. When broken, their lithium-ion batteries can easily catch fire. AVD (a pioneering fire extinguishing agent) fire extinguishers can be used to put out these fires.

The other risk is explosions of gas bottles and canisters, in particular resulting from the rise in the use of nitrous oxide, popularly referred to as laughing gas, as a recreational drug. Veolia UK experienced more than 25 serious incidents of explosions and damages at energy recovery facilities last year due to discarded canisters, costing the company £1.4 million from outages and repairs. 

Thankfully the boilers are very tough – 120 bar pressure tested – so most explosions do not close down the facility, they just pause the process before the gases can stabilise.

Other than removing some gas bottles, the waste is not sorted before it is poured into the holding pit. A manually operated claw is used to mix the waste to allow an even burn. 

The claw

The process

Waste is fed into a chute with a ram feeder into the furnace where it combusts. It is combined with pre heated oxygen to produce ‘syngas’, to allow for a full combustion. Ammonia is injected at this point as this helps break down the NOx gases (nitric oxide and nitrogen dioxide). The heat at one point exceeds 850 degrees, to allow for a full breakdown of all materials. High risk medical waste is not treated here, as the temperatures need to be even higher, so need sending to a specialised incinerator. 

The hot gases from the furnace travel through a boiler, heating water that runs through pipes to create steam. The steam spins a turbine to generate electricity, of which 16MW/hr is then exported to the grid.  2MW/hr is used on site for running the fans and all the other electrical equipment of the facility. 

Incinerator bottom ash (IBA) is the noncombustible residue left over after waste is burned in an incinerator. It’s a complex mixture of irregularly shaped particles that can include metals, rubble, concrete, minerals, ceramics, and glass. IBA can also contain heavy metals, organic compounds, and other toxic contaminants. This is treated to remove contaminants and reused as an aggregate in construction.

On the tour

Control of pollutants and safety

The exhaust combustion gas is highly acidic, so 3 tonnes of lime is added during the process to neutralise these gases, help remove sulphur dioxide and other contaminants. There is a whirlwind within the reactor that binds the acids to the lime. These are then removed as a solid ash known as Air Pollution Control Residues (APCr). These are hazardous and have a high pH, heavy metal content and persistent organic pollutants such as dioxins. At Newhaven, these are containerised in bespoke bags – Martin calls them Gucci bags because they are so expensive – to then have them transported by train to have them securely stored at Minosus – Veolia’s underground storage facility at a salt mine in Cheshire. Newhaven ERF generates about 6000 tonnes of this difficult waste per year. 

Processes are also in place to remove ferrous metals from the ash pit, as well as aluminium.

The emissions to air of the facility through its twin stacks are very tightly controlled. Until last year 10mg/m3 of air dust particles were permitted, this reduced to 5mg/m3 last year. The actual emissions from this facility are 1mg/m3, five times lower than the permitted maximum.

Alongside the reactor tower

The steam at the end of the process amounts to 80 tonnes per hour, where it is cooled to condense back into liquid water.

The facility runs at 100% capacity all the time, with planned outages every 2 years, at which time all the hotels in Newhaven get booked up to accommodate all the contractors carrying out maintenance. 

It was reassuring to see how thoroughly the automated process is monitored, with the gas being analysed instantly at every point in the process and banks of screens. 

The control room

One aspect of the visit that made for it being a bit stranger than necessary was a testing of the public address system which went on for an hour ‘Attention please, attention please…’. It was just bad luck that this once a month test was happening during our visit.

A frustration for me was seeing just how much waste is being incinerated that has the potential to be recycled, if only we the consumers could make the effort to separate it out better when we can.

On the tour

By Dominic Manning
Article featured in Rye News 2nd August 2024

Information

Smartie Lids

One of our unique postcards – can you spot the secret message?

‘Chocolate Beans’ were first produced by Rowntrees in 1882, priced at 2d, but became ‘Smarties Chocolate Beans’ in 1937, and following a trade description issue became ‘Smarties’ shortly after. Production stopped during WW2 due to restrictions on non-essential items, and was reintroduced in 1946 with plain chocolate centres instead of the usual milk, due to the demand for fresh milk. Sweet rationing was not lifted until 1953! Supplies were becoming more stable and Smarties went back to their original specification.

Plastic lids were first used on Smarties tubes in the 1950s, and in the 1960s letters (and occasionally numbers) were added to the underside of the lids, These were designed as a teaching aid, and collected by children.

The lids have undergone many changes over the years. Early lids carried the Rowntrees logo with a letter or number on the back. Some of the early letters were upper case, which were later replaced by lower case letters, just before the change to the new metric size somewhere between 1965 and the mid-seventies. The old imperial lids(A) were 1″ in diameter, slightly larger than the 22 mm metric lids (B), and only came in dark blue, yellow, orange and green.

In the early 1990s Nestle bought out Rowntrees, and the ‘Rowntrees’ wording on the lid was replaced with ‘Smarties’ (C).

Many limited editions have been introduced over the years. Special colour lids were often linked to the smarties inside, for example:
– a white lid (with blue and white ‘Smarctic frostbite’ Smarties containing white chocolate, early 2000s)
– a special green lid (with Gruesome Greenie Smarties)
– a special blue lid (with blue Smarties)
– a silver lid (with brown and red cola-flavour Smarties, 2000)
– metallic lids featuring dinosaurs on three colours of Smarties (~2000).

Special symbols on the reverse of the lids include a Smartian set of 8 different designs in 4 different ‘day-glo’ colours from 1995-96 and a further Smartian set in green in 2002.

There was a football set FROM 2000 with 8 different words (PASS, CORNER, TACKLE, FOUL, BOOKED, PENALTY, SHOOT, GOAL) and 8 different colours.

Much of the information and images here were sourced from various websites including here.

Information

Container Spills

The world’s largest container ship, MSC Irina (Image: Vessel Finder)

It is said that 90% of everything that we eat, wear and consume has once been in a container and transported on a container ship. In 2022, over 250 million containers, with their cargo worth trillions of dollars, were transported around the world. At any point in time, more than 6,000 container ships are in operation.

The 20-foot container, referred to as a Twenty-foot Equivalent Unit (TEU) has become the industry standard reference, so cargo volume and vessel capacity are commonly measured in TEUs. The largest container ships can carry more than 24,000 TEUs, carrying everything from toys to trainers, from figs to fridges, and from motorbikes to medical tape.

MV Rena Monrovia, which grounded off the coast of New Zealand in Oct 2021 (Image: Tasmanian Times)

These containers may be properly packed, stowed and secured, but stacked ever higher, and with factors ranging from severe weather and rough seas to ship groundings, structural failures, collisions, or even human error, some never reach their destination, and are lost at sea. The World Shipping Council, which aims to improve safety in container handling and transport, reported that in the twelve years up to 2020, an average of 1,382 containers fell overboard each year. The winter of 2020-21 saw an unusually high number of weather-related incidents, with an average loss over of more than 3,000 containers over the two-year period 2020 to 2021. In 2022, 661 containers were lost, the lowest percentage loss since records began in 2008.

Containers may break up whilst falling off the ship or hitting the sea floor but also may remain intact for a period of time. The ship’s captain has a responsibility to report to the coastguard any container loss that is either a hazard to shipping or the contents are hazardous.

Unfortunately it seems many of these contents (including plastic) are not deemed a hazard. That is where we can begin to help. When we walk beaches, we can record items that keep washing onto our beaches – HP ink cartridges, Pulman slippers, tea capsules, various shoes and more. Recording may lead to identification of pollution sources and perhaps in time a change of law.

HP ink cartridge (Image: Wikidéchets)

Strandliners aim to catalogue container spill items that have polluted our shores so that more accurate information is available. We also aim to build a table of recorded losses in the English Channel and in the Atlantic that have brought items to our beaches.

One of our much-used sources of information, Wikidéchets, no longer seems to be available, but there are records of finds here.

Information

Detonation cord from the USA?

At first glance this 3mm diameter plastic cord or line looks like any other piece of marine debris washed up on our British coastline. Potentially from the fishing or shipping industries, but taking a closer look it seems a little different, stronger and more akin to strimmer line. What would strimmer line be doing in the marine environment, would it come from gardens backing onto beaches?

Take an even closer look and you discover the texture is very rough, strimmer line is usually smooth. And the final observation to discount all previous theories is that it is a tube! There is a hole all through each piece, whether yellow, orange or (rarely purple or green). This is nothing like anything we had observed before. Some research was needed.

With a little investigation, we were able to find out more from Laura Ludwig at the Centre for Coastal Studies (shown in the image above).

And here’s the timeline…

First noted as a new item washing up on south coast beaches in October 2022 – Cuckmere Haven, East Sussex

Discovered as a new item washed up by Strandliners in January 2023 at Dungeness, East Sussex

More than 50 pieces (between 3.5 & 35 inches in length) recorded on Brighton beach in November 2022

Recorded at Newhaven beach in March 2023 for the #PreventingPlasticPollution project with the @TheRiversTrust.

Identified in April 2023 as ‘explosive shock tubing’, it was used to transmit a charge to underwater explosives during a Boston Harbour dredging project that ran from June 2021 to January 2022.

Multiple records at every beach litter survey with Strandliners in East Sussex and Kent from throughout 2023, and by other beach cleaners who ask questions of what is found.

Hold on though! There is another potential source but the timing is not right. The Rampion Wind Farm was constructed off the Sussex coast and opened in 2018. Shock tubing may have been used in the construction but if the shock tubing we are finding is from the wind farm construction, why was there a 4 year delay for it to travel the 10 to 50 km? And the tubing is very abraded, more than a 10 to 50km journey’s worth of washing around the ocean!

Here is a Citizen Science project used for recording where these waste pieces of plastic are washing up. The aim is to use the data to encourage the U.S Army Corps to change systems so that there can be a reduced environmental impact. https://anecdata.org/projects/view/1041

Here is the reason why we are all part of the cause of this American explosive shock tubing polluting the south east England coastline:

1 – Why was it used in the first place?
To deepen the harbour at Boston Harbour, Massachusetts.
2 – Why did Boston Harbour need to be made deeper?
To allow a greater percentage of New England cargo to be shipped through the Port of Boston, rather than through the ports of New York and New Jersey, and permit larger fleets of greater TEU container ships to use the channel without delays due to tides.
3 – Why do larger fleets of container ships need to enter Boston Harbour?
Container ships hold thousands of containers full of consumer goods. These ships now carry up to 25,000 containers around the world from port to port. But the larger the ship the larger and deeper the port needs to be. Most ports were able to continue being a destination for the transit of containers without the need of underwater quarrying (dredging in some form is usual) until these ships became so large.
4 – Why are these container ships increasing in size?
The global market for consumer goods is increasing – we demand a greater choice of goods from all over the world.
5 – How are we connected with larger container ships?
90% of all we own has once been in a container. The more things we buy, the more things are made, the more things made require larger means of transport. Many of the things we buy are part of a global trade. When we click ‘buy now’, do we consider the impact of the fossil fuel used to transport that item to us – up to 300 tons of fuel per ship per day – and the pollution it causes?

What can we do?
We can reduce the impact of container ships and our global consumerism by choosing to buy local wherever possible. Local trade of local things made from local raw materials reduces the need for these increasingly larger and larger container ships and will reduce the pollution of their travel.

Did you know?
Up to 2019, 300 to 2,000 containers are lost at sea every year, through extreme weather conditions and an increased urgency by the ship owners for global deliveries to be quicker and quicker. Between Nov 2020 and Jan 2021 alone, 2,675 containers were lost overboard!

The contents of the containers are unknown to us, and don’t even need to be reported, unless the contents are toxic or the container is a hazard to shipping.

Information

Wallowbird Film Project

How did we come to this?

A year ago, Strandliners started working with a film crew on a project that has become known as Wallowbird, a short documentary film examining plastic pollution in the UK.  The Strandliners River Rother clean-up and brand audit was only a very small part of this film, but we are pleased to be able to tell the story.

Lost or discarded waste washed up in the River Rother strandline.

The River Rother in East Sussex is a tidal river with saltmarsh and grassy upper banks. With stormy weather coinciding with spring high tides much mismanaged waste is stranded along with much organic material from upstream.

Wildlife are at home here.
Small groups of volunteers steadily collected everything manmade from the strandline.
Heavy loads wheeled back and then dropped off at a local industrial unit.

#plasticoceanseurope
#plasticoceansinternational
#wallowbird
#wallowbirdfilms
#Strandliners
#CleanerRiversCleanerSeas
#cleaningupisnotenough
#dataisevidence
#BreakFreeFromPlastic
#beyondthebeachclean


Information

North American Fishing Tags

Transatlantic fishing tags and licences

These coloured plastic tags, lost from ships or fishing gear, can be found on the strandline. Some are local (Sussex IFCA), but some have travelled on transatlantic currents to find their way to our shores in the same way as sea beans. In the image above you can see lobster trap tags from the Eastern Seaboard of the U.S. & Canada. They are used as fishing licences for every fishing person and for every trap used. These may be renewed every year, or may be multi-year tags. Generally, single year tags are a specific colour. For example, in Atlantic fishing areas from 1 April, 2022 to 31 March 2023, the colour will be purple for Newfoundland and Labrador. Multiyear plastic tags must currently be white. There are regulations for the replacement of lost tags, which should be strictly controlled. 

The letters and numbers show the location and sea area, date, and species (lobster, crab etc.) the tags have been used for.

ME = Maine
MA = Massachusetts
RI = Rhode Island
C = Connecticut
D = Delaware
M = Maryland
NH = New Hampshire
NFLD = Newfoundland

Fishing licence

A fishing licence, issued to the fisher person, gives the name of the fishing vessel, and often includes the name (and even the telephone number!) of the fisherman. Some are in remarkably good condition, considering their age. A surprising amount of information was found about the licence above, which was found locally.

Have you found any of these tags? Strandliners is creating a database of tags found on the Kent and Sussex coast. We need information including, if possible…

What it is? (does it need identifying?)
Any photo available?
Location, where found (nearest town, beach/riverbank, lower beach, strandline or back of beach)
Date (day or season and year)
Size (width x height)

Please email [email protected] with any records, historic included, of these special treasures.

Information

Sea Beans

A variety of sea beans

Sea bean is the name given to a drift seed. That is a seed that can float and drift on the ocean surface driven by the currents and wind, to be washed ashore on a distant beach. The Sea bean website (www.seabean.com) is a good resource, as is the book ‘Sea-Beans from the Tropics’ by Ed Perry IV and John V. Dennis. Some are not beans at all, but fruits that contain seeds.

In the UK there are local seeds that float and can drift a short distance down a river or along the coast. We find conkers (Horse Chestnut), hazelnuts, acorns and beech mast on the strandline, especially in autumn. Some seeds we find, like peach and avocado stones, may have been discarded by beach visitors. We also find sea kale seeds, which use the wind and sea to disperse. These seeds would only survive a short time in the salt water and still be viable. 

But then you come to the true sea beans, and it is these that have spectacular journeys. The most common ones that wash up on the northwest coastline of Europe are transatlantic travellers and will have started their journey in Tropical America or the Caribbean. They drop to the ground from a vine or bush, into a watercourse or when rain floods the ground, they float out to the ocean. They can float for up to 30 years (research still ongoing!) and drift on the Gulf Stream and North Atlantic Drift to eventually land on our beaches. To do this, they must have hard, impermeable coats and contain air pockets to enable them to float.

While commonly found in Florida, they are scarce on the west coast of Scotland, Ireland and Cornwall (maybe 1,000 to 5,000 recorded in each area from 1690 to 1990), and incredibly rare on the southeast of England (under 10 recorded from 1690 to 1990).  

Sea beans have been drifting across the Atlantic since time immemorial but plastic from the Americas also follows the same currents. Transatlantic plastic is a very important constituent of beach and plastic pollution as non-native species can hitch hike across the Atlantic Ocean and land on our shores, with the potential to cause an imbalance of our own fragile marine and coastal ecosystems.

We think seven sea beans have been found recently by volunteers on Strandliners surveys. Surveys are one of the best ways to find them as they involve close scrutiny of what has washed in. 

But we would like to know what you have found so that we can create a Strandliners database of sea bean discoveries on the southeast coastline. Could you tell us what you found, where and when you found it, with a photograph if possible.

We need information including, if possible…
What it is? (Does it need identifying?)
A photo
Location, where found (beach/riverbank, lower, strandline or back?)
Date (day or season and year)
Size (“diameter x height” or “width x height x depth”?)

Please email [email protected] with any records, historic included, of these special treasures.